LiDAR
Note
The following device tests are verified in the ROS2 environment. Please refer to the Tool Installation section and install all ROS-related tools.
Laser LDS-50C-E
Preparation
- Rhino Pi-A1
- Laser LDS-50C-E BlueSea LiDAR
- 12V power supply for the LiDAR
Hardware Connection and Network Configuration
Connect the LiDAR to the 12V power supply, connect its Ethernet port to any network port of the Rhino Pi-A1, and configure the default IP (you can use ifconfig to configure a temporary IP).
The LDS-50C-E connects to the Rhino Pi-A1 via a standard Ethernet interface with an Ethernet cable. To ensure normal communication between the LiDAR and the Rhino Pi-A1, both need to be on the same subnet. The factory settings of the LiDAR are as follows:
- LiDAR IP: 192.168.158.98
- LiDAR subnet mask: 255.255.255.0
- LiDAR gateway: 192.168.158.1
- LiDAR default upload address: 192.168.158.15
The Rhino Pi network settings are as follows:
- Network port IP: 192.168.158.15
- Network port subnet mask: 255.255.255.0
- Network port gateway: 192.168.158.1
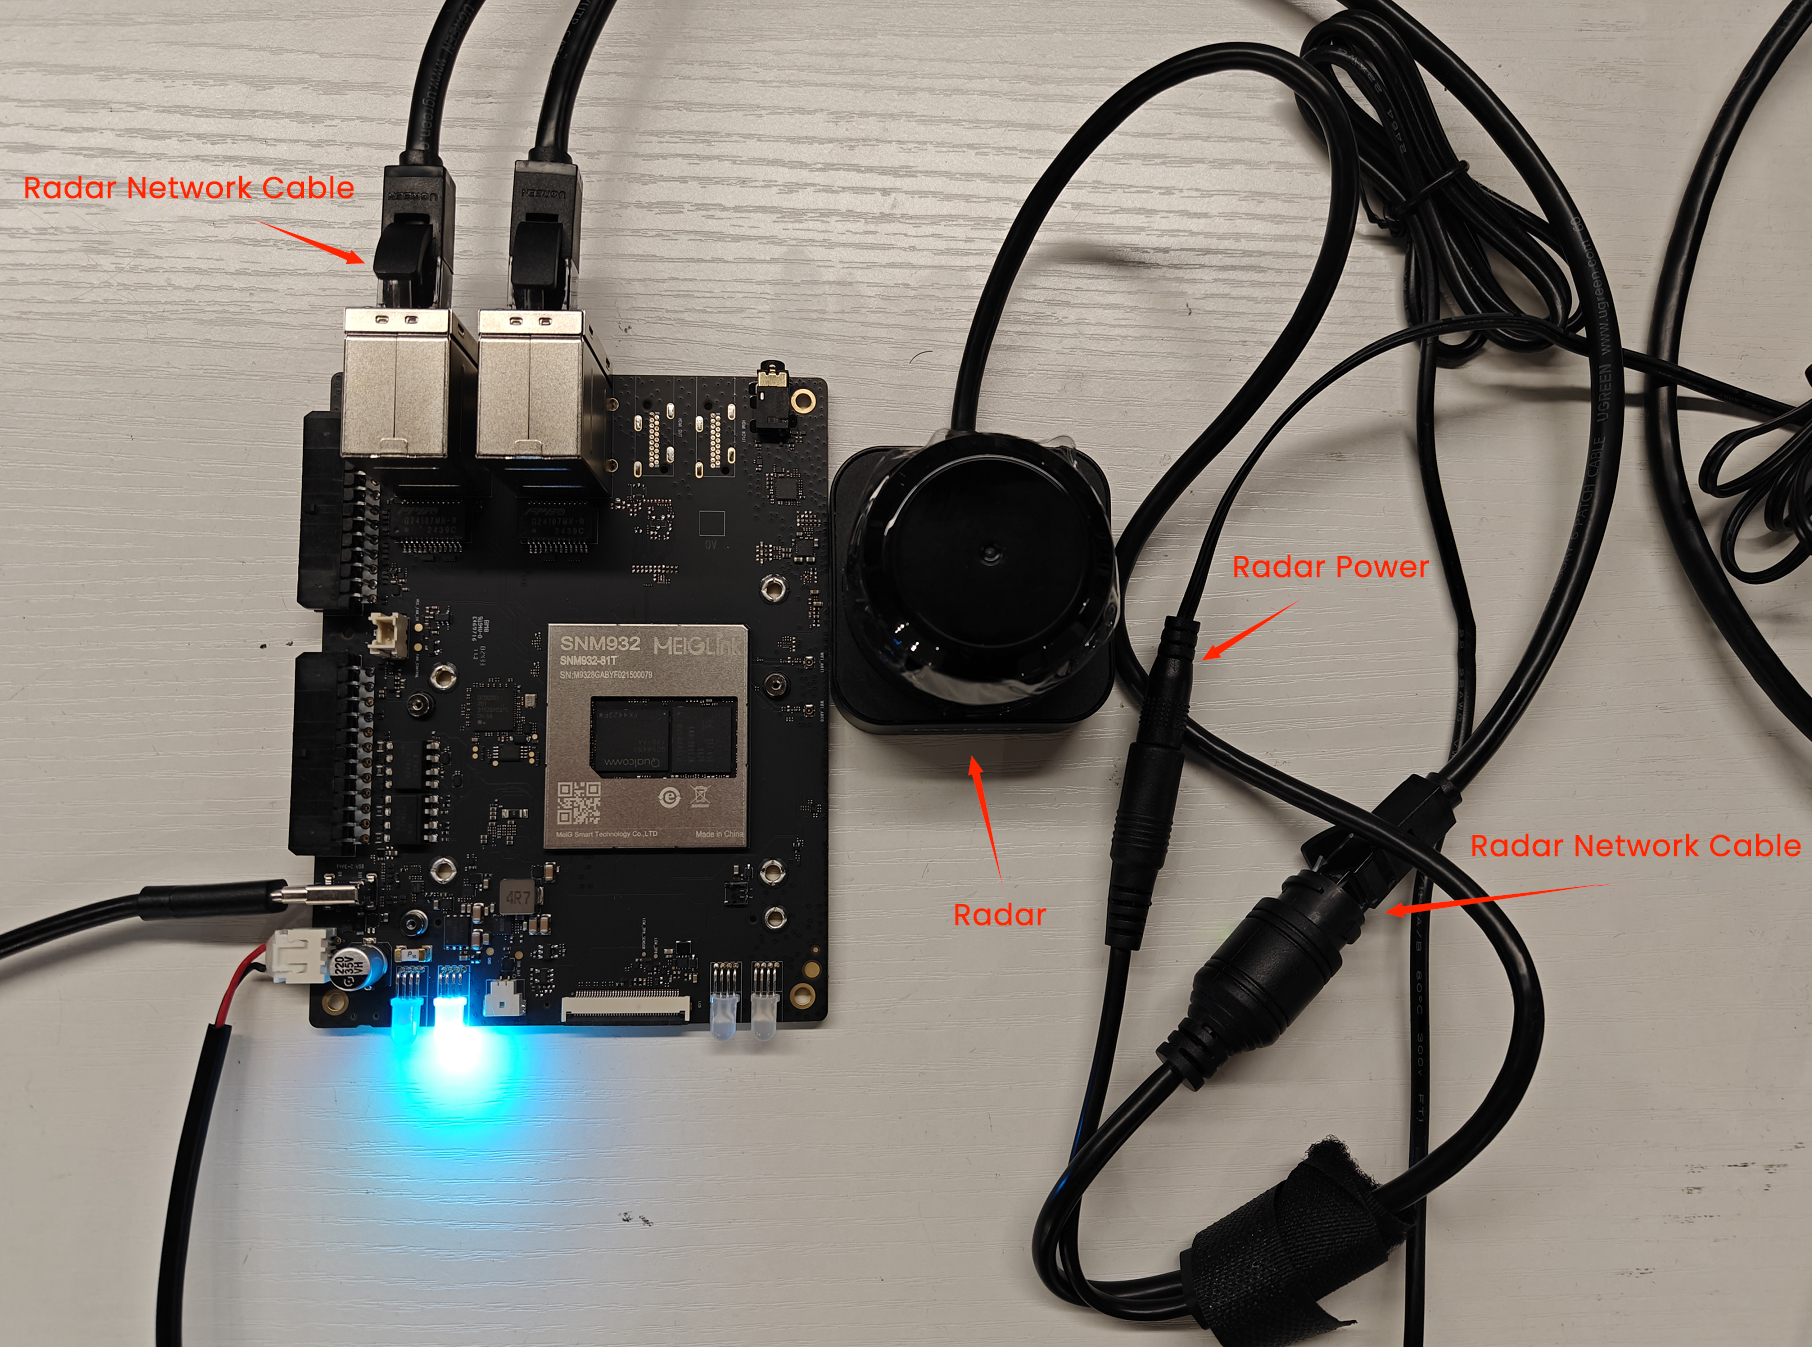
After connecting the cable and configuring the IP, use the Ping command to check whether the network is connected.
Obtaining and Building the BlueSea ROS2 Driver Package
After connecting via a VNC tool and opening the Ubuntu desktop, execute the following commands in sequence:
- Obtain the BlueSea ROS2 driver from GitHub and deploy it to the corresponding location
sudo su  // password: aidlux

mkdir bluesea2
cd bluesea2
git clone https://github.com/BlueSeaLidar/bluesea-ros2.git src- Install dependencies
sudo apt update
sudo apt install -y python3-colcon-common-extensions- Build
colcon build- Update the current ROS2 package environment
source ./install/setup.sh- Run the driver with ROS2 launch
ros2 launch bluesea2 udp_lidar.launch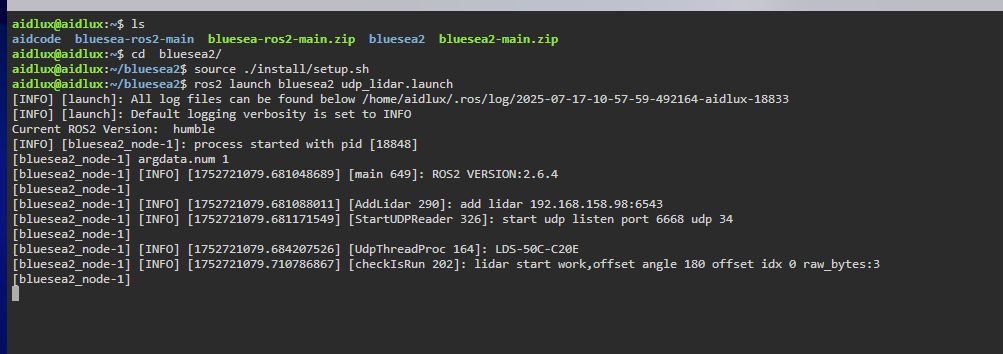
Testing
After connecting via a VNC tool and opening the Ubuntu desktop, execute the following commands in sequence:
- Data verification: check whether the scan outputs normally
ros2 topic echo /scan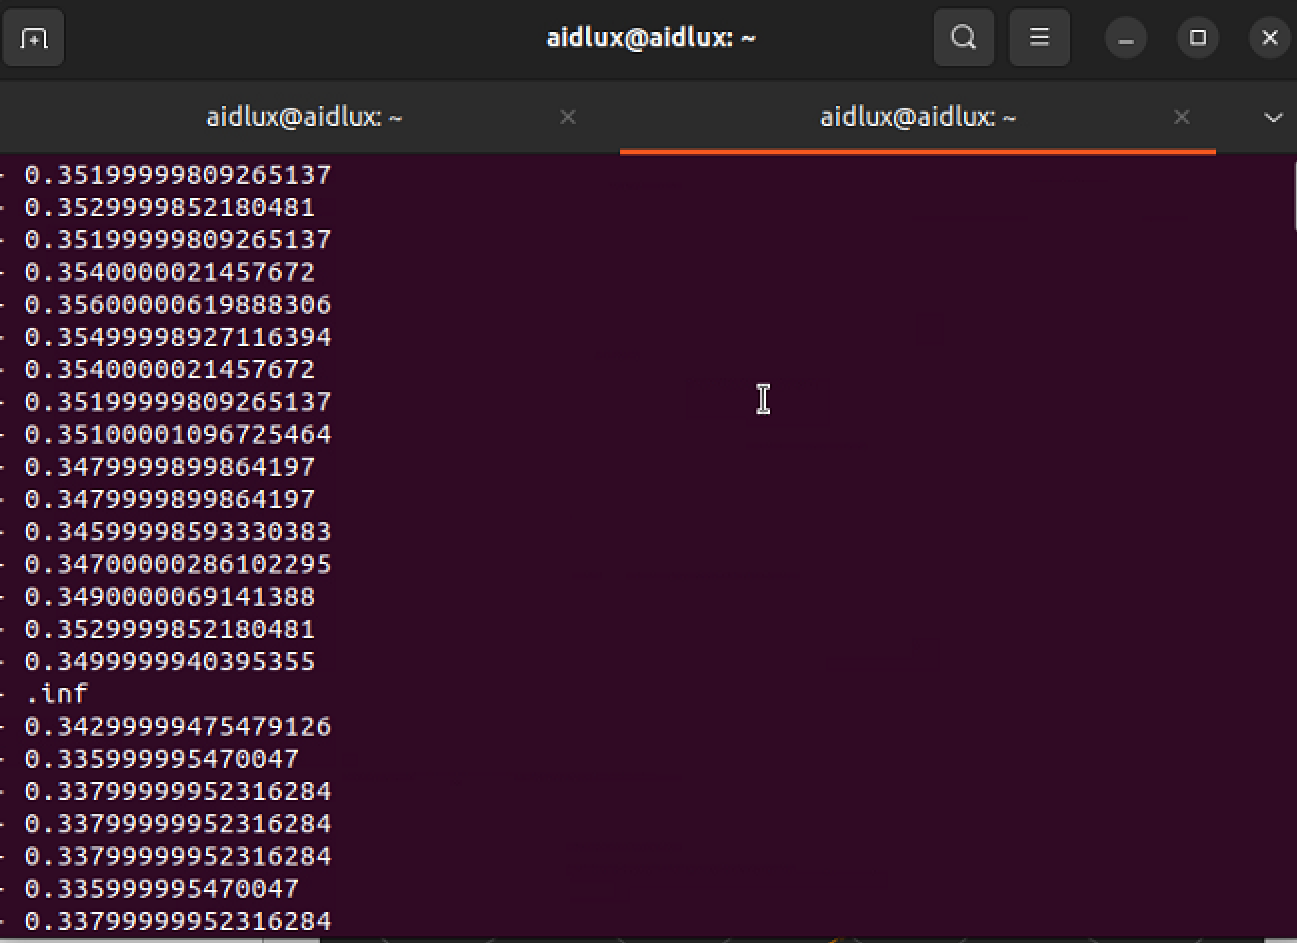
- Open the visualization tool rviz2
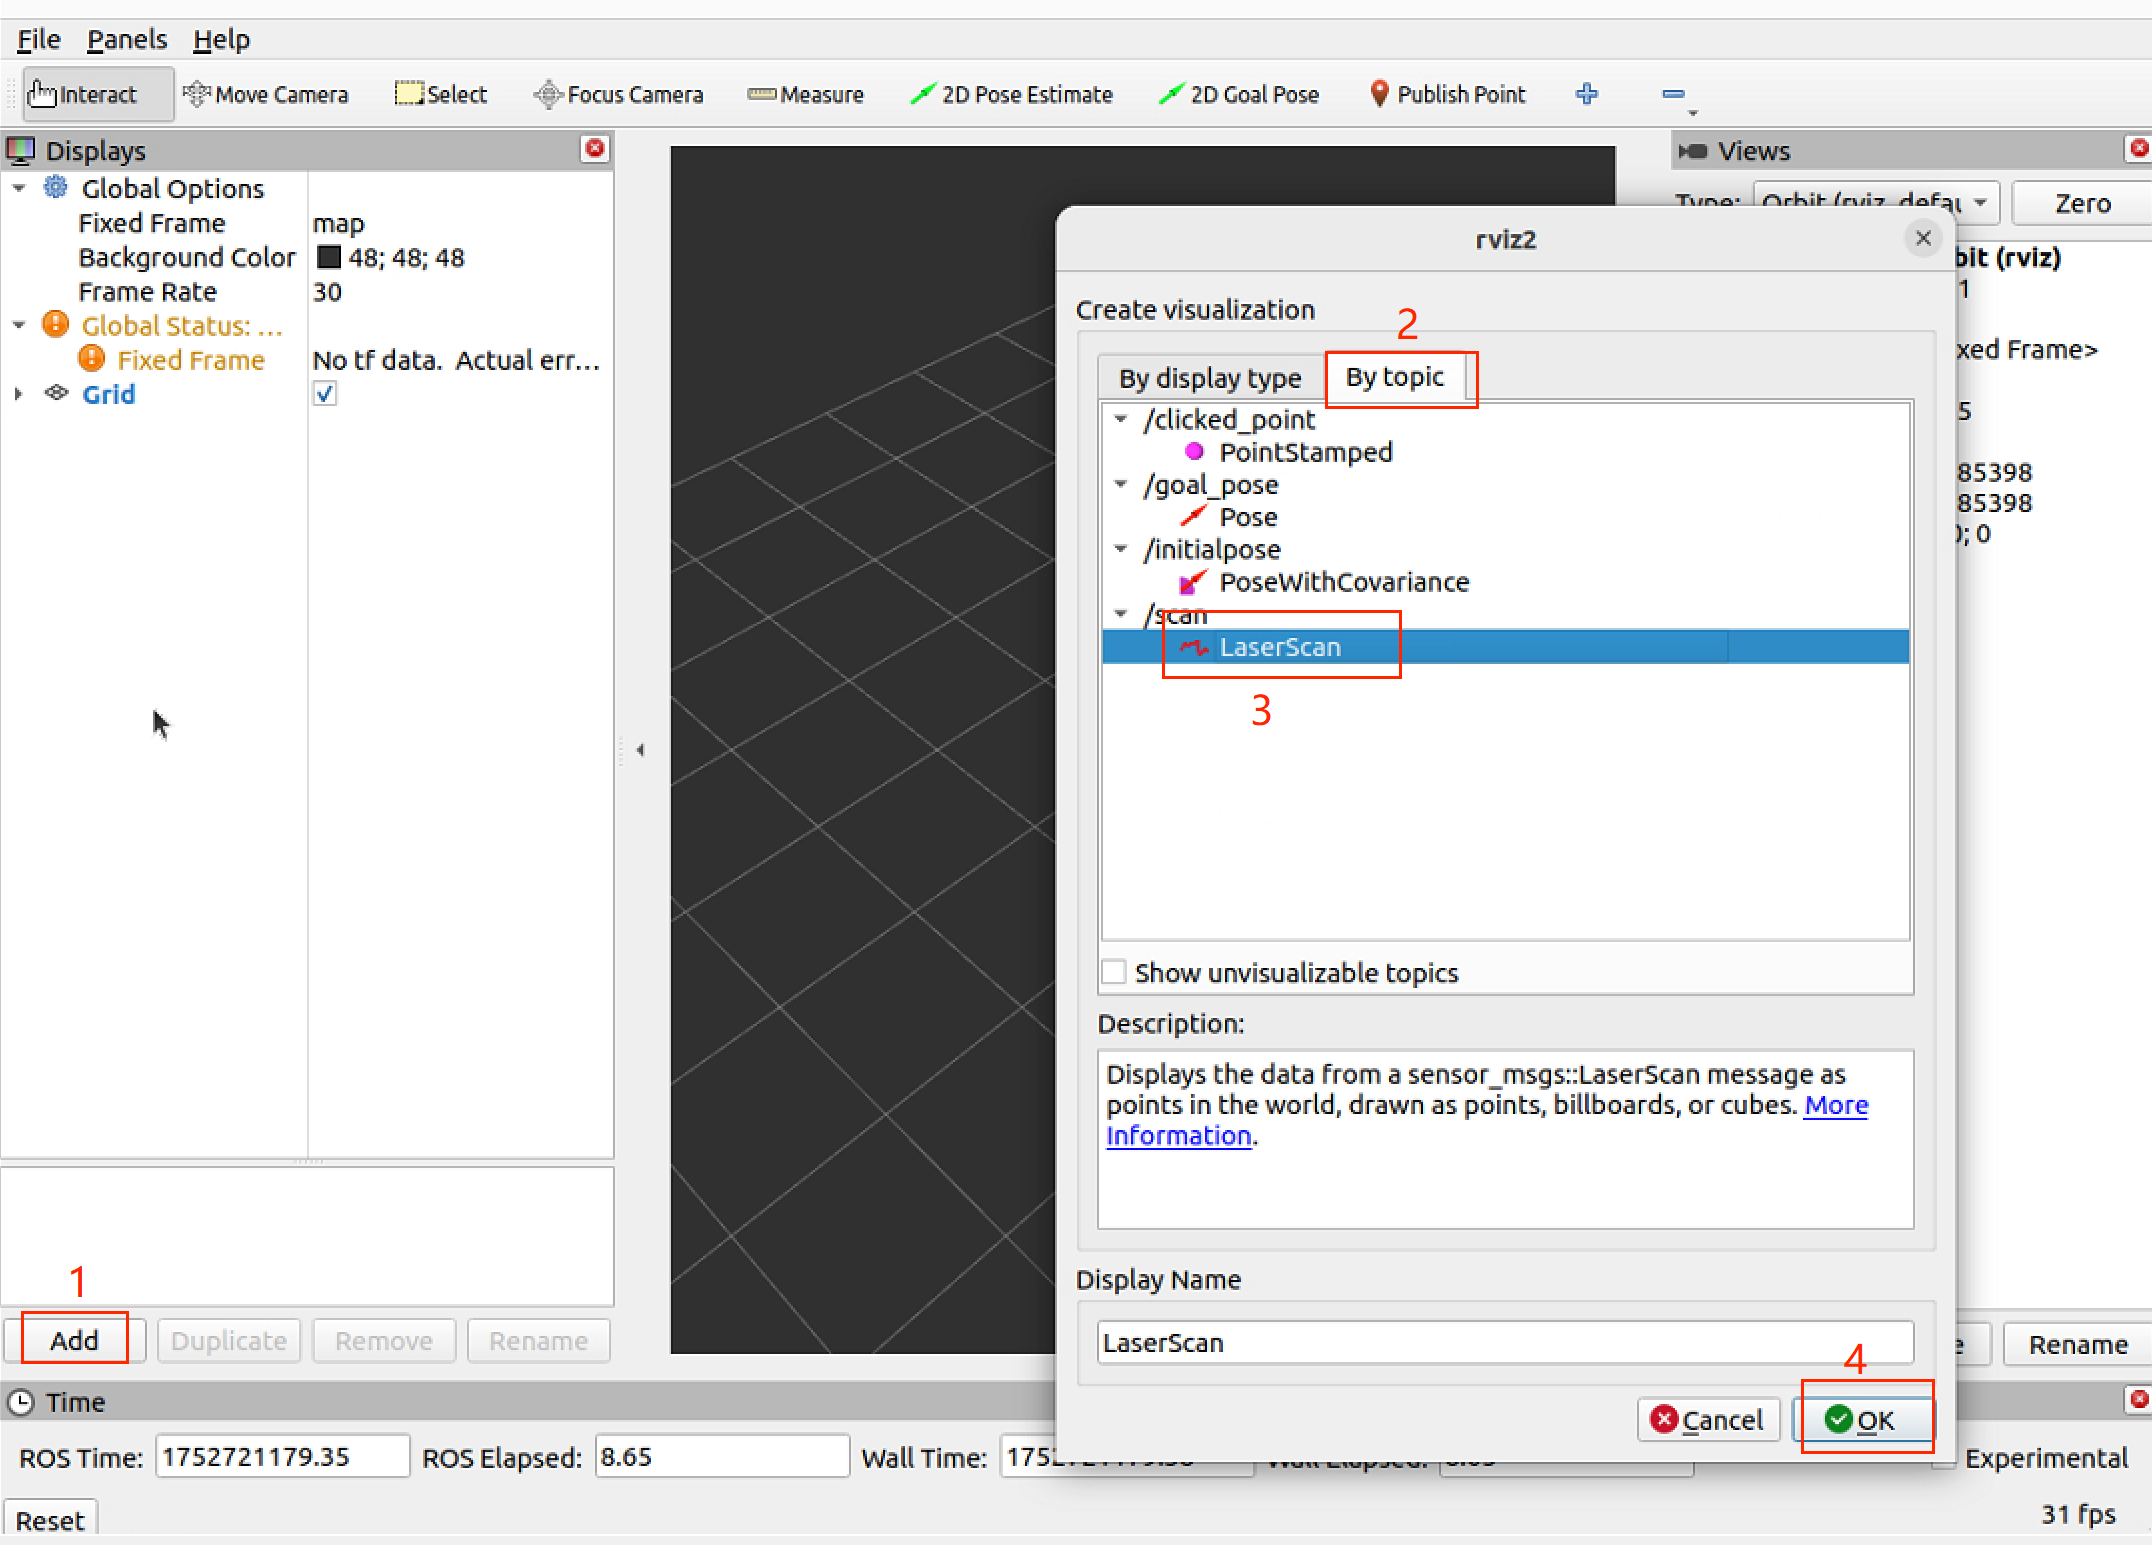
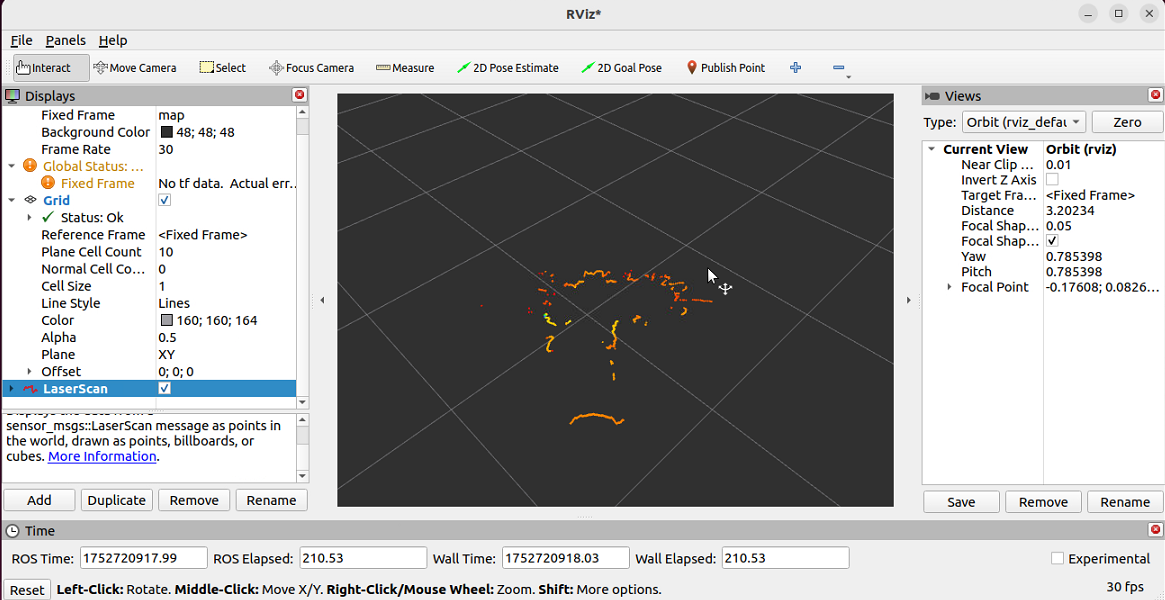
rviz2- After opening, click the buttons in sequence to open the visualization interface